Statistics
Use the Statistics page to monitor your channel performance, campaign results, and revenue share earnings. Statistics are grouped into three tabs:
- Channel — stream and game performance.
- Revenue — revenue share campaign performance and earnings.
- Events — activity from your connected streaming platforms.
Channel
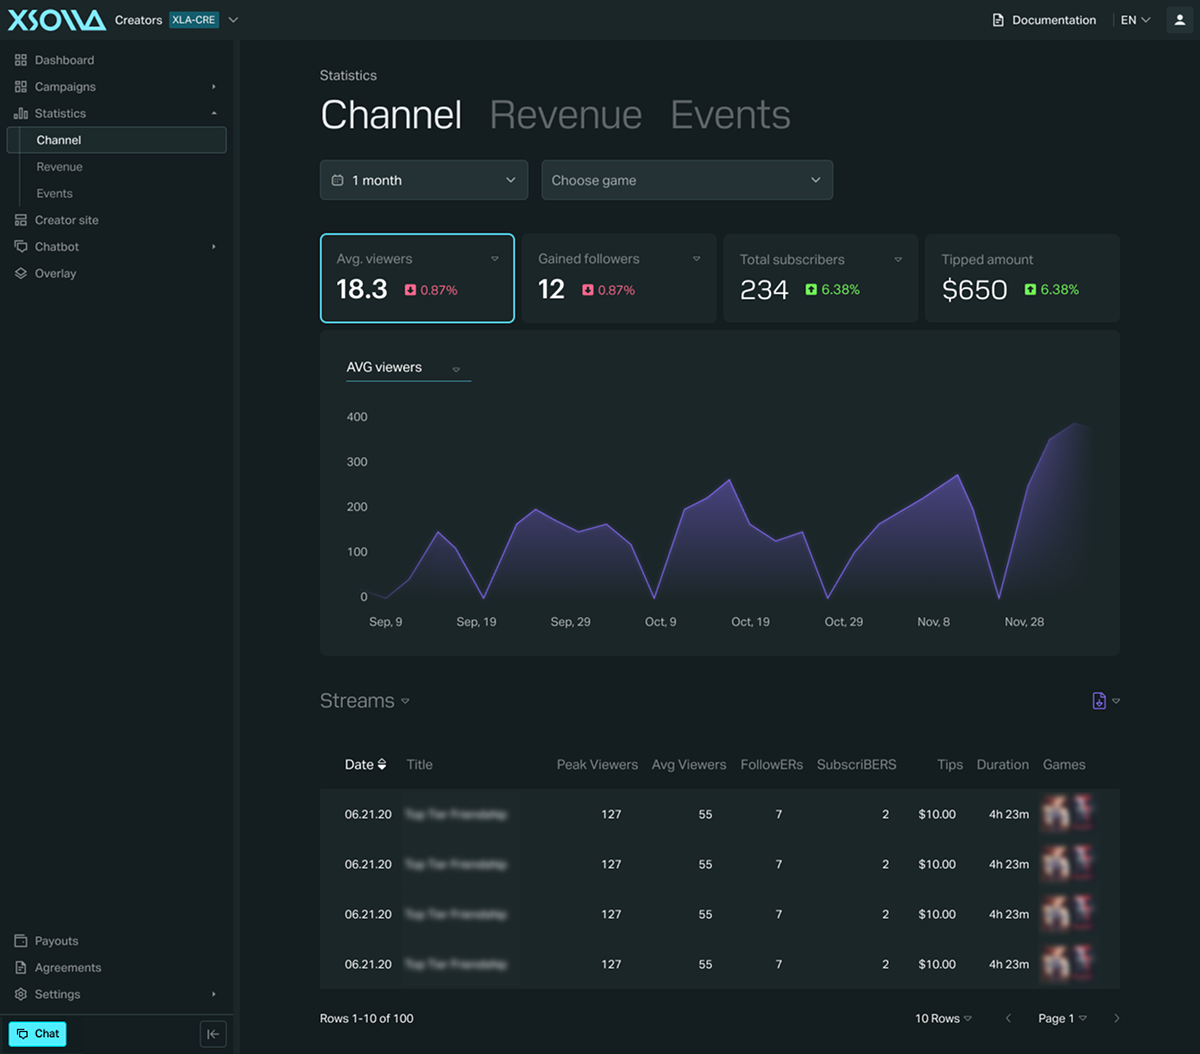
The Channel tab provides statistics about your streaming activity. At the top of the page, you can view summary metrics for the selected reporting period, including:
- Average viewers
- Gained followers
- Total number of subscribers
- Chat messages
Below the summary, you can view performance by individual streams or by games.
Revenue
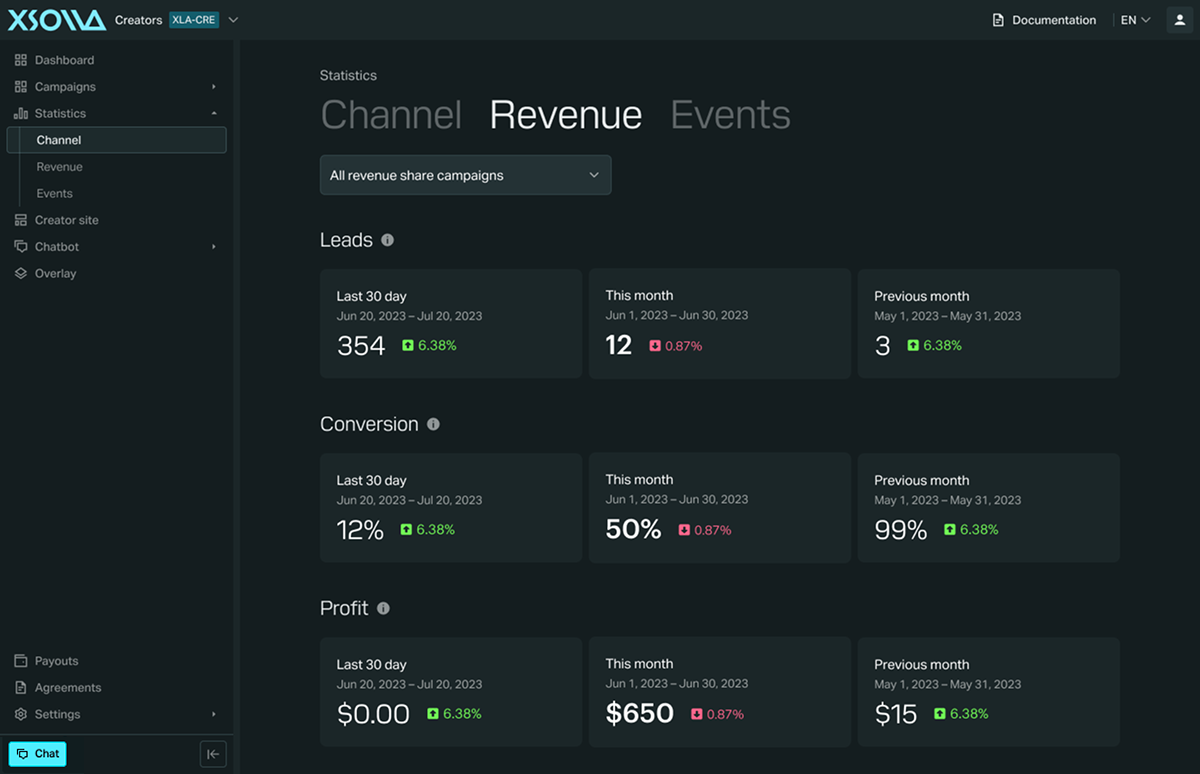
The Revenue tab shows the performance of your revenue share campaigns. Use the campaign selector to view statistics for all campaigns or for a specific one. The dashboard displays the following metrics:
- Leads — the number of clicks and visits your tracking link or storefront have generated.
- Conversion — the percentage of leads that resulted in a completed purchase.
- Profit — your revenue share earnings from those purchases.
Events
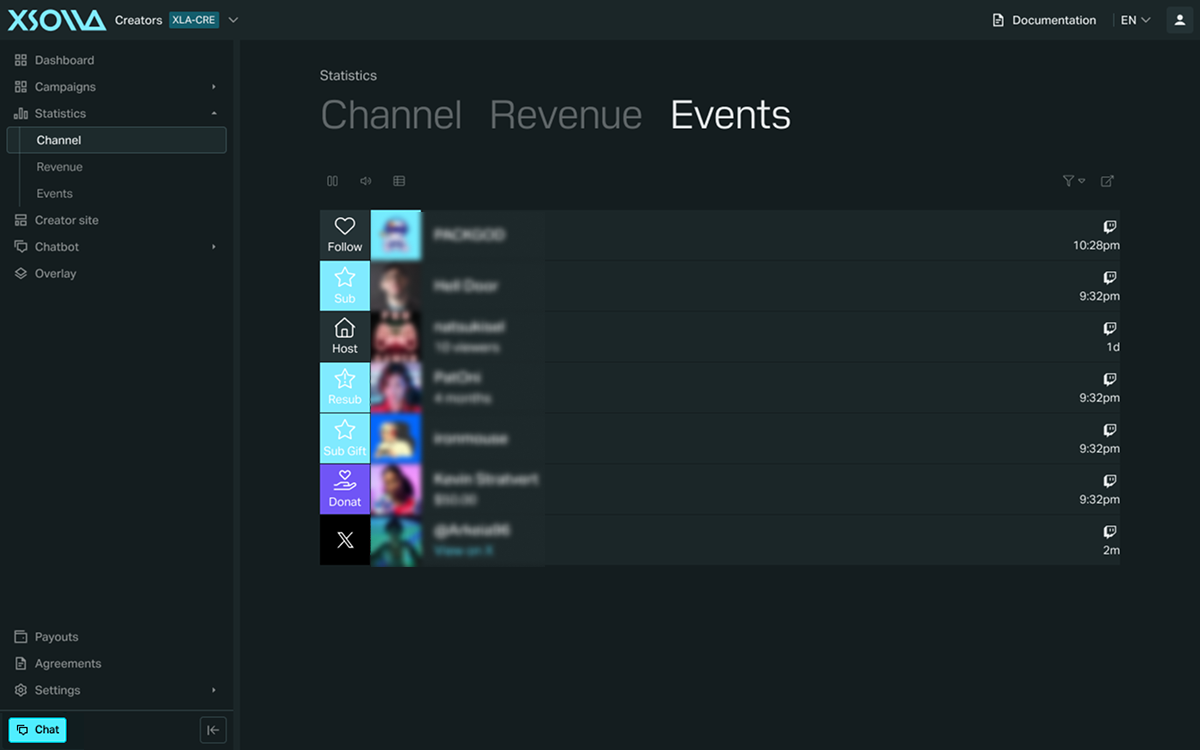
The Events tab shows activity from your connected social media accounts. Depending on accounts you’ve connected, events include followers, subscribers, resubscribers, raids, cheers, tips, and charity donations.
Found a typo or other text error? Select the text and press Ctrl+Enter.
